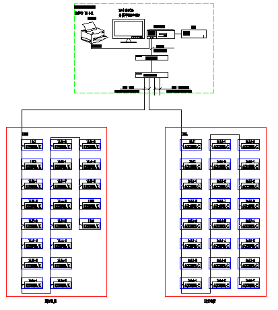
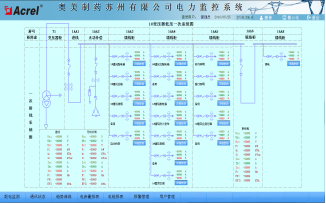
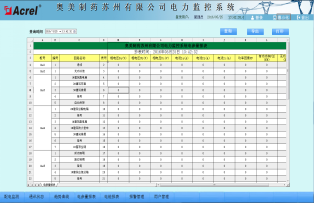
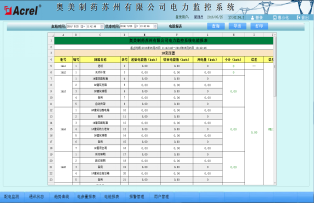
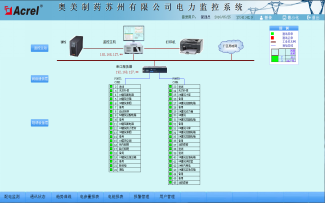
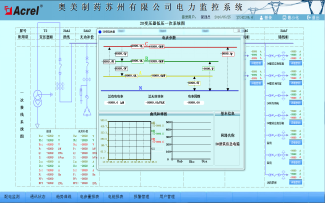
Arkori Qingqing Jiangsu Ankerui Electric Appliance Manufacturing Co., Ltd., Jiangyin, Jiangsu 214405, China Abstract: This paper introduces the power monitoring system of Australia-US Pharmaceutical Suzhou Co., Ltd. It adopts smart power meter to collect various electrical parameters and switch signals at the distribution site. The system adopts the on-site local networking method. After networking, it communicates via the field bus and transmits it to the background. The Acrel-2000 power monitoring system realizes the real-time monitoring of power distribution circuit substations in substations. Keywords: Large-scale manufacturing enterprises; Australia-US pharmaceutical Suzhou Co., Ltd.; 0.4KV substation; smart power meter; Acrel-2000; power monitoring system 0 Overview AUS Pharmaceutical Suzhou Co., Ltd. is located 400 meters north of the intersection of Zhongtang Road and Zhenbei Road in Huqi District, Suzhou City, Jiangsu Province. This project is the power monitoring of Suzhou Aumei Substation. According to the requirements of power distribution system management, power monitoring must be performed on the low-voltage distribution outlets within the two substations of the Wuhu standard factory building to ensure the safety, reliability, and efficiency of electricity usage. Acrel-2000 low-voltage intelligent power distribution system takes full advantage of the latest developments in modern electronic technology, computer technology, network technology and fieldbus technology, and conducts distributed data collection and centralized monitoring and management of the power distribution system. The secondary equipment of the distribution system is networked. Through the computer and the communication network, the field devices of the decentralized power distribution station are connected into an organic whole, and remote monitoring and centralized management of the power grid operation are realized. 1 System Structure Description The monitoring system mainly realizes the 0.4kV power distribution system of 2 substations of Suzhou Omega Pharmaceutical Co., Ltd. for power monitoring and power management. The monitoring range includes two ACR220ELK self-manufactured ACR220ELK self-manufactured models of two low-voltage line cabinets, connecting cabinets and feeder cabinets of two 0.4KV transformer substations for remote real-time monitoring and power management. The system consists of 45 multi-function power meters, divided into 2 buses. The two buses are pulled to the serial port server through a shielded twisted pair cable and uploaded to the duty room monitoring host through data processing to achieve data connectivity between the meter on the bus and the monitoring host. The monitoring system adopts a hierarchical distributed structure, ie station control layer, communication layer and bay layer; as shown in Figure (1): Figure (1) Low-voltage network topology The main equipment for the bay is: Ankerui multi-function network power meter, switch, analog acquisition module and intelligent circuit breaker. These devices are corresponding to the corresponding primary equipment installed in the electrical cabinet, these devices are used RS485 communication interface, through the on-site MODBUS bus network communication, data acquisition on the spot. The network communication layer is mainly a protocol conversion isolator. Its main function is to convert RS485 signals into RS232 signals and complete the data exchange between the field layer and the station control layer. Station control management: equipped with high-performance industrial computers, monitors, UPS power supplies, printers and other equipment. The monitoring system is installed on the computer to collect and display the operating status of the field equipment and display it to the user in the form of human-computer interaction. The above network instruments all use RS485 interface and MODBUS-RTU communication protocol. RS485 adopts shielded wire transmission. Generally, two wires are used for connection. The connection is simple and convenient. The communication interface is half-duplex communication, that is, both parties can receive and send data. Only data can be sent or received at the same time. The maximum data transmission rate is 10Mbps. The RS485 interface is a combination of balanced drivers and differential receivers. It has enhanced noise immunity and allows up to 32 devices to be connected on the bus. The maximum transmission distance is 1.2 km. 2 main functions of the power monitoring system 2.1 Data Acquisition and Processing Data acquisition is the basis of power distribution monitoring. Data collection is mainly accomplished by the underlying multi-function network instrumentation to achieve local real-time display of remote data. The signals that need to be collected include: three-phase voltage U, three-phase current I, frequency Hz, power P, power factor COSφ, power Epi, and remote device operating status. Data processing is mainly to display the electrical parameters collected according to requirements in real time and accurately to the user, to achieve the automation and intelligent requirements of the distribution monitoring, and at the same time storing the collected data into the database for user query. 2.2 Human-computer interaction The system provides simple, easy to use, and good user interface. Using the Chinese interface, the CAD graphic shows the electrical main wiring diagram of the low voltage distribution system, shows the status of the distribution system equipment and the corresponding real-time operating parameters, the screen timing switching tour; dynamic refresh of the screen real-time; analog display; switch display; continuous Record display and so on. 2.3 Historical events The historical event viewing interface provides convenient and friendly human-computer interaction for the user to view fault records, signal records, operation records, and over-limit records that have occurred. You can view the platform through historical events. You can easily locate your own according to your requirements and query conditions. The historical events that you want to view provide you with good software support for the operation of the entire system. 2.4 Database Establishment and Query It mainly completes the remote measurement and remote signal acquisition, and establishes a database to generate reports regularly for users to query and print. 2.5 User Rights Management For different levels of users, different permission groups are set to prevent the losses caused by human misoperation to production and life, and to realize the safe and reliable operation of the distribution system. You can use user management to perform user login, user logout, password change, and add/delete operations to facilitate the user's modification of accounts and permissions. 2.6 Running load curve The load trend curve function is mainly responsible for regularly collecting incoming lines and important loop current and power load parameters, and automatically generating running load trend curves to facilitate users to know the operating load status of the equipment in a timely manner. Click on the screen button or menu item corresponding to complete switching of the respective function; real-time view the historical trend line or trend curves; curve can be selected to pan, zoom, and other operations range conversion, to help the user into the line fault trend analysis and recall, Provides intuitive and convenient software support for analyzing the health of the entire system. 2.7 Remote Report Query The main function of the report management program is to design the report style according to the needs of the user, and the data processed in the system is filtered, combined and statistically generated to generate the report data required by the user. This program can also be based on the needs of users of the report file to save, print or summon save, print mode. At the same time, this program also provides users with management functions for generated report files. The report has the functions of freely setting the query time to realize daily, monthly, and annual energy statistics, data export, and report printing. 3 Case Studies The monitoring area of ​​the U.S. and U.S. Pharmaceutical Co., Ltd. power monitoring system is 2 substations. This project aims at the electricity monitoring and power management of the 10/0.4kV distribution system in this substation; the monitoring range is 0.4KV low-voltage circuit in the substation. The low-voltage line cabinets, contact cabinets and feeder cabinets are used for remote real-time monitoring and power management. The ACR220ELK multi-function instrument is used in the in-out line circuit, which is a network power meter designed for the power monitoring needs of power systems, industrial and mining enterprises, public facilities, and intelligent buildings. It can measure all conventional power parameters such as three-phase voltage, Current, active power, reactive power, power factor, frequency, active power, reactive power and other electrical parameters. And this instrument has 4 photoelectric isolation digital input contacts and 2 relay control output contacts. These contacts can be used with intelligent circuit breakers to achieve remote signaling and remote operation of the circuit breaker. The series of network power meters are mainly used in substation automation, distribution network automation, residential power monitoring, industrial automation, energy management systems and intelligent buildings. The secondary map of low voltage distribution is shown in figure (2). The main function of the power meter remote monitoring is to monitor the electrical parameters of the operating equipment, including: three-phase voltage, current, power, power factor, electrical energy, frequency and other electrical parameters and distribution loops. Three-phase current; remote signal function to display the operating status of field devices, mainly including: switching of the switch, closing operation status and communication failure alarm; when the circuit breaker is dislocated, an alarm signal will be issued to remind the user to deal with the fault in time. Figure (2) Secondary diagram of low voltage distribution The remote signaling and telemetry alarm functions mainly complete the monitoring of the switching operation status and load incoming line of the low-voltage outlet loops, and indicate the specific alarm position and audible alarm to the switch displacement and load over-limit pop-up alarm interfaces, prompting the on-duty personnel to deal with them in time. The load limit can be set freely under the corresponding authority. With history query function. See Figure (3) and Figure (4). Figure (3) Real-time remote alarm information Figure (4) Historical telemetry alarm information query The parameter reading function mainly inquires into the electrical parameters of the low-voltage outlet circuit. Supports electrical parameter query at any time, with functions such as data export and report printing. The report queries the electrical parameters of the low-voltage loops for the two transformer substations of the 2 substations, mainly including: three-phase current, active power, active power, and transformer temperature. The names of the loops in this report are associated with the database to facilitate the user to modify the loop name. See Figure (5). Figure (5) Parameter meter reading The electricity consumption report function can select the time period to inquire, supports the accumulated electricity inquiry at any time, and has the functions of data export and report printing. Provide accurate and reliable power report for duty personnel. The names of the loops in this report are associated with the database to facilitate the user to modify the loop name. As shown in the figure below, the precise power consumption of each distribution circuit in a certain period of time, the user can directly print the report, and can be saved to other locations in EXCEL format. See Figure (6). Figure (6) Energy Report The schematic diagram of the system communication structure mainly shows the network structure of the system. The system adopts a hierarchical distributed structure and simultaneously monitors the communication status of the equipment at the bay level. Green indicates normal communication and red indicates communication failure. See Figure (7). Figure (7) System Communication Structure The load trend curve interface allows you to visually check the load operation of the loop. View real-time and historical trend curves, click the corresponding button or menu item to complete the switching of corresponding functions; help the user to enter the trend analysis and fault recall, with curve printing function. Provides intuitive and convenient software support for analyzing the health of the entire system. See Figure (8). Graph (8) Trend Graph 4 Conclusion With the development of society and the wide application of electricity, the power monitoring system has become an inevitable choice for large-scale multi-substation users, such as key construction projects, landmark buildings, and large-scale public facilities throughout the country. The Acrel-2000 power monitoring system introduced in this paper is introduced. In Australia and the United States Pharmaceutical Co., Ltd., the application can realize real-time monitoring and power management of power substation low-voltage distribution circuits, not only can display the power status of the circuit, but also has network communication functions, and can be composed of serial server, computer, etc. The power monitoring system facilitates the remote management of the on-duty personnel of the substation, which is conducive to saving the time of energy meter reading and brings informatization into the distribution monitoring. The system analyzes and processes the collected data, displays the operating status of each distribution circuit in the substation in real time, has a pop-up alarm dialog box and voice prompts for the closing and closing of the load, and generates various energy reports and analysis curves. Graphics, etc., to facilitate remote meter reading and analysis, research. The system is safe, reliable and stable, providing real and reliable basis for users of substations to solve electricity problems and achieving better social benefits. [2] references: [1]. Ren Zhicheng, Zhou Zhong. Principles and Application Guides for Digital Meters for Electric Power Measurement [M]. Beijing. China Electric Power Press, 2007. 4 [2].Zhou Zhouzhong, et al. Product Selection and Solution for Smart Grid User-end Power Monitoring and Power Management System[M]. Beijing. Machinery Industry Press. 2011.10
Maximum Load:100.00t
Eurocrane Corporation is a leading
global Crane manufacturer and service provider. Outfitted with advanced
manufacturing equipment, our modern facility becomes the working home of many
crane professionals with great expertise and experienced in the crane
manufacturing industry. Hence we have the ability to ensure each product is
completed to a high level of safety, reliability and quality. We offer a full
range of spark-resistant, explosion-proof cranes that meet various customer
needs. Our product conforms to the latest explosion protection standards. It
has found wide use in food, chemical, and petroleum and natural gas industries
as well as in any potentially explosive environment.
We strictly follow the related ATEX
100a (94/90/CE) directives and CE directives in making qualified chain hoist
that can be used in Zone1, Zone 2, Zone 21, and Zone 22 areas as classified in
the ATEX directives.
Explosion Proof Crane,Explosion-Proof Single Girder Crane,Gantry Crane,Girder Bridge Hoist Crane Eurocrane (China) Co., Ltd. , https://www.craneparts.pl